Glue Up Opportunities offers three distinct ways to visualize your deals and opportunities in the pipeline. These views help you analyze your business prospects from different perspectives, making it easier to manage and track your sales process. Let’s explore each of these views and how to access them.
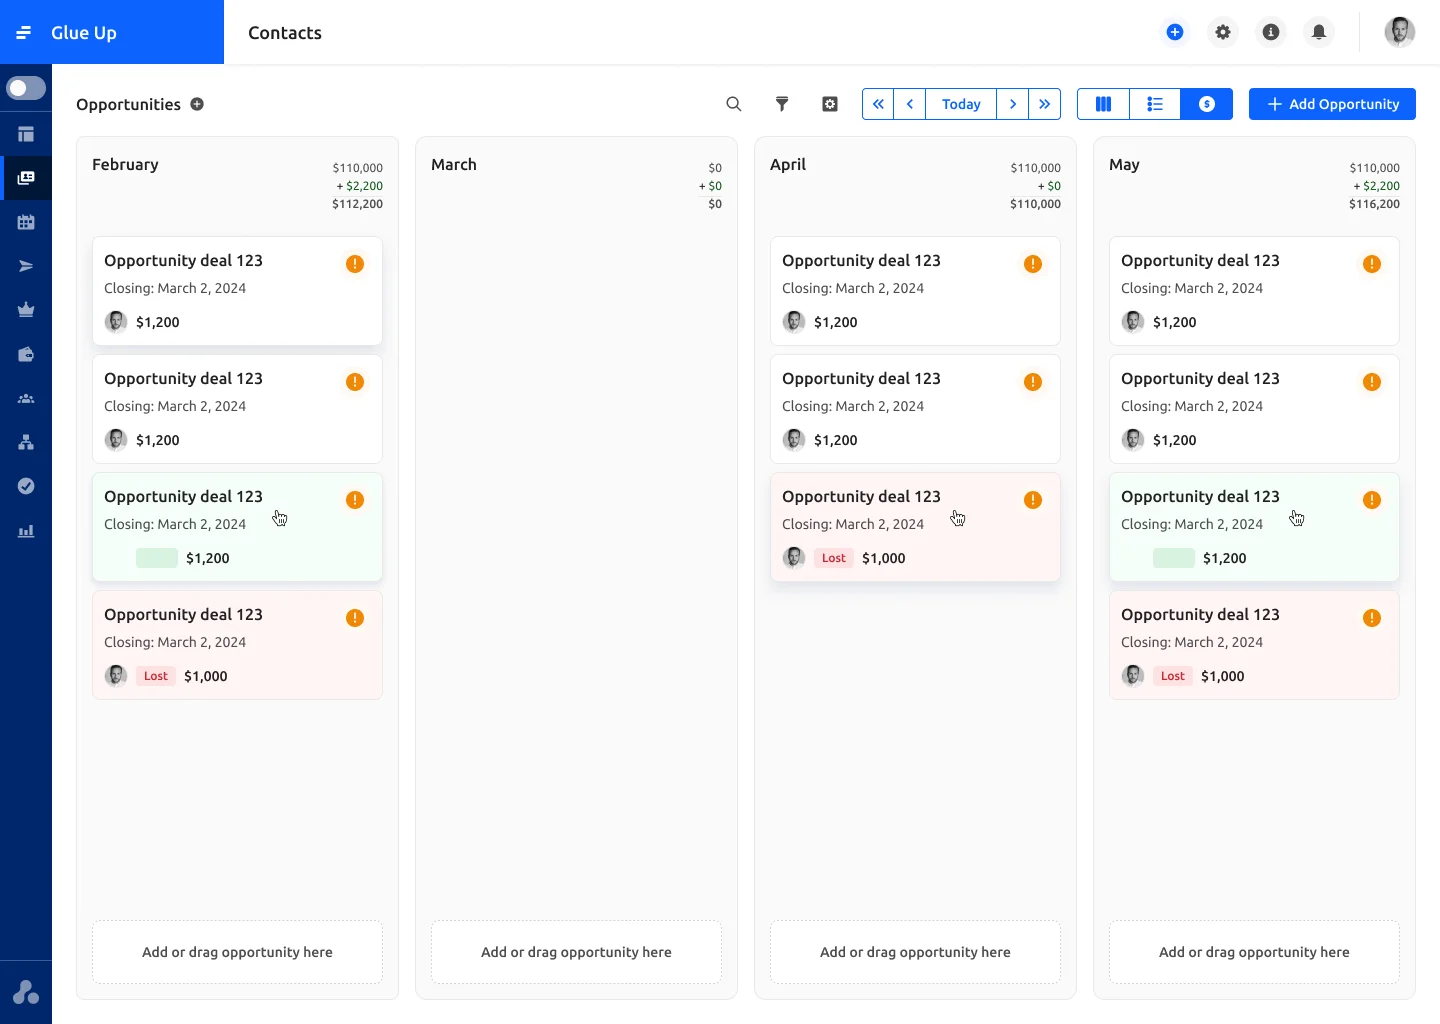
1. Table (Kanban) View
The table view presents your opportunities in a board-like format, allowing you to see the progress of deals through different stages. This visual representation helps you quickly identify bottlenecks and prioritize tasks.

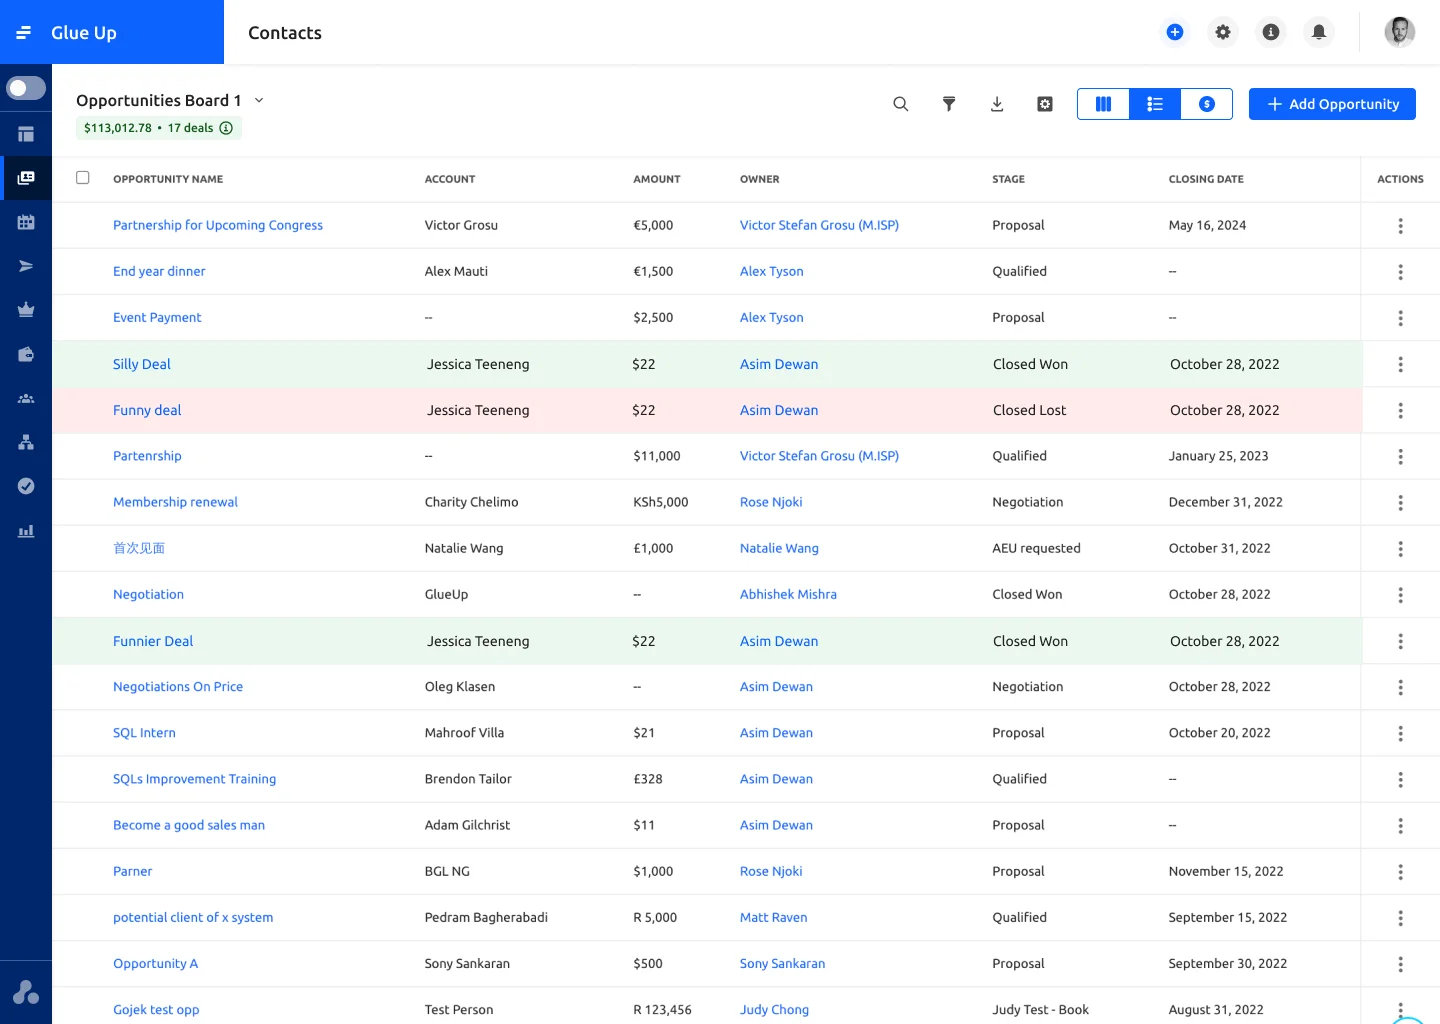
2. List View
The List view displays your opportunities in a traditional, spreadsheet-style format. This view is ideal for those who prefer a more detailed, data-driven approach to tracking their deals.
3. Forecast View
The Forecast view provides a predictive outlook on your opportunities, helping you estimate future sales and revenue. This view is particularly useful for planning and strategizing.
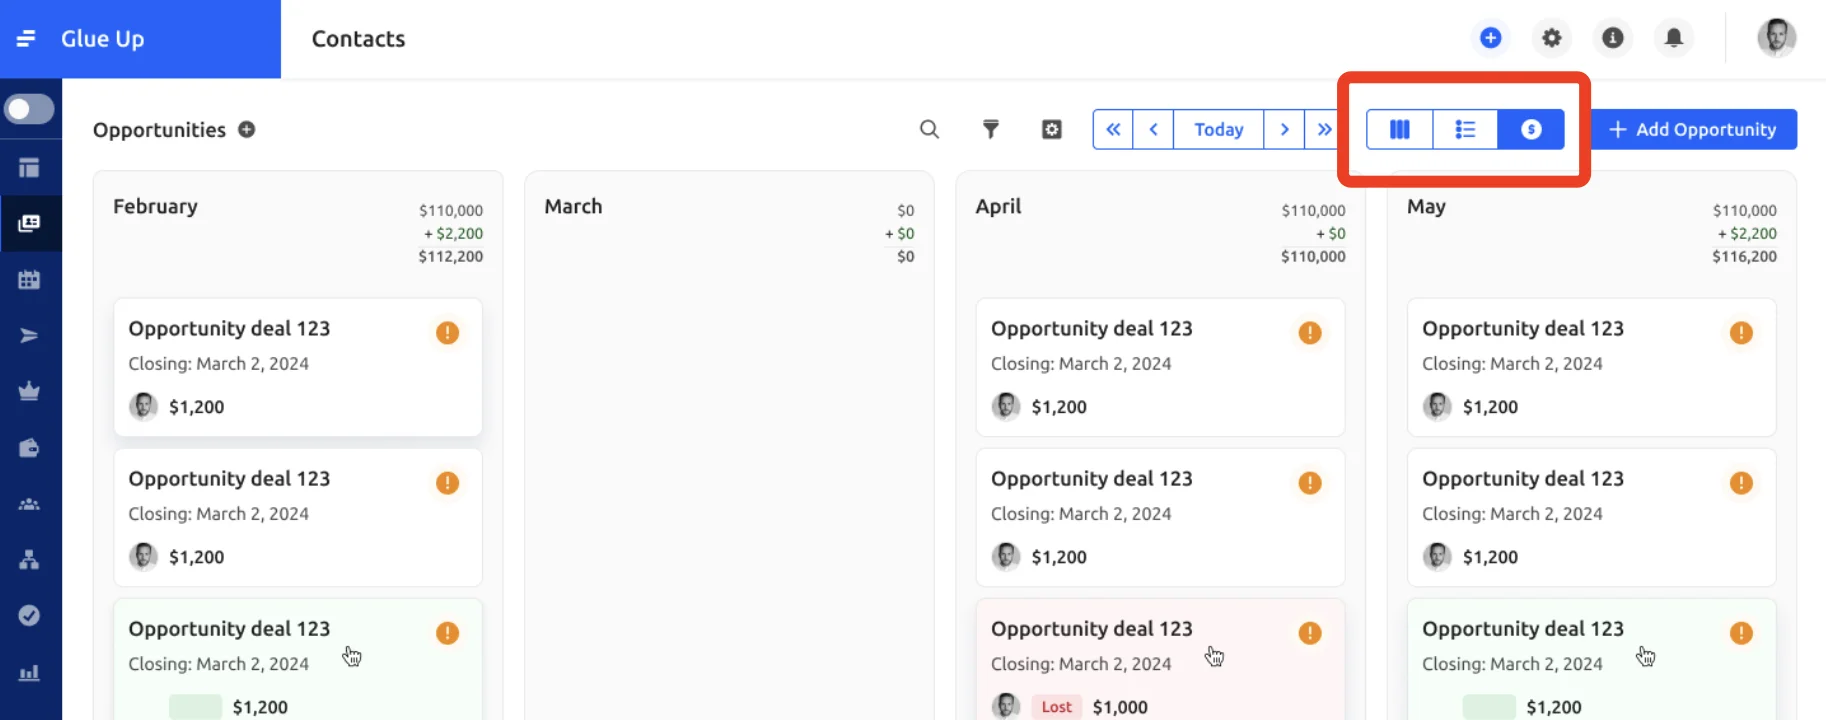
How to Switch Between Views: To change between these different views, follow these simple steps:
- Look for the blue “Add Opportunity” button on your Glue Up platform.
- Next to this button, you’ll find a selector.
- Choose your preferred view: Kanban, List, or Forecast.
By utilizing these different views, you can gain a comprehensive understanding of your sales pipeline and make informed decisions to drive your business forward. Experiment with each view to determine which works best for your needs and workflow.